I’m rather caught up in the past lately, what with working on the War Resisters League 100th anniversary and helping finalize an unpublished autobiography by WWI resister and war tax resister Max Sandin. So, lacking any other ideas for a post here, I decided see what was in the NWTRCC newsletter 10 years ago.
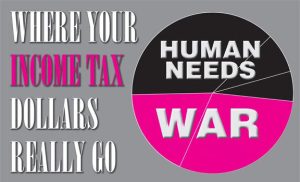 The front page article was about the confusion around various presentations of the military budget by peace groups and the proper terms to use to explain those percentages. The article sets out to explain the differences among “discretionary spending,” “mandatory spending,” “federal funds,” “trust funds,” and “Where Your Income Taxes Really Go.” The confusion is pretty much the same today, so if you need a refresher, that newsletter is still online at https://nwtrcc.org/wp-content/uploads/2015/10/mtap0213.pdf. Another good source is the National Priorities Project website, which includes a Federal Budget 101 section with explanations about the budget process and also a Glossary that includes the terms above.
Looking at that issue from Feb./March 2013 also reminded me that some may be wondering if War Resisters League is producing a new pie chart this year. The answer is yes. It looks like Biden is releasing the 2024 budget on March 9, so as soon as it’s online we’ll work as fast as we can on the analysis and get it printed and posted online. The timeline is a bit tight for tax day, but at least this year we will be able to work from current numbers. Last year Biden’s budget came out some time after tax day. Of course, how much any administration’s budget reflects reality is an open question. It will be interesting to see the accounting for all the money they have been shipping off periodically to keep the war in Ukraine going.
 That newsletter also has a commentary by Gary Erb, who, among other things, takes issue with how the federal debt is presented on the pie chart. I am not sure we have ever satisfied his concerns, but we will make an effort this year to reconsider the percent of the debt that is war-related. This is a tough one to sort through. Historically war has been the major contributor to federal debt, but the previous president’s tax cuts, the pandemic and some of Biden’s programs have added significant amounts more recently. Whether we’ll stick with the 80% is an open question for now.
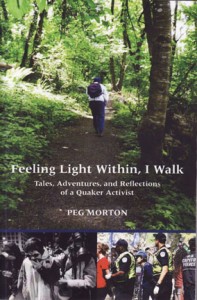 If budget talk makes you yawn, that newsletter has a write-up of a member survey that might hold some insights for organizing today. And there’s a review of Peg Morton’s memoir, Feeling Light Within, I Walk: Tales, Adventures and Reflections of a Quaker Activist. She died in 2015, and her book is a good read about a life well lived.
— Post by Ruth Benn
Co-author of the WRL pie chart
[Editor’s Note: The latest WRL pie chart can be found here.]
Great post. I love showing people the pie chart so I’m glad we will have an updated version soon. And Peg’s book is a good read!! There are still copies available if anyone wants one. You can email me at suebarnhart2@gmail,com to get one.